MLFlow Reporting
UV supports reporting to an MLFlow backend via the
uv.mlflow.reporter.MLFlowReporter class. Using this reporter, you can
easily log your parameters, tags, and metrics to a local directory or to your
existing MLFlow backend:
import uv
from uv.mlflow.reporter import MLFlowReporter

def train(steps: int, slope: float):
  for i in range(steps):
    uv.report(step=i, k='my_metric', v=i*slope)

def main(**kwargs):
  with uv.start_run(), uv.active_reporter(MLFlowReporter()):
    uv.report_params(kwargs)
    train(**kwargs)

main(steps=8, slope=1.0)
Here we can see the steps needed to set up and use an MLFlowReporter. We
start an MLFlow run using
with uv.start_run() so that our run will be properly closed when our code execution
is finished. Then we create an MLFlowReporter and set it as active using uv.active_reporter().
Once we have done this, we are ready to store parameters and log metrics to our MLFlow backend.
By default, this will create a directory ./mlruns in your current folder and store
your metrics data there. To view the results in your browser, you can run an
mlflow ui instance in your current folder:
mlflow ui
By default, this serves results at http://localhost:5000. Open this page in your browser
and you should be able to view the results of your run.
You can change the MLFlow experiment and run names by setting the environment
variables MLFLOW_EXPERIMENT_NAME and MLFLOW_RUN_NAME, respectively, or you can set
the experiment_name and run_name parameters in the uv.start_run() method. You can
also use an existing MLFlow tracking server by setting the MLFLOW_TRACKING_URI environment
variable.
Please see our mlflow tutorial code for a complete example.
For a more involved example that uses Caliban to build Docker images and integrate with an existing MLFlow SQL-based backend, see this tutorial.
Querying MLFlow Data
As the tutorial above shows, you can use UV to log data to an MLFlow backend, and use MLFlow’s ui server to browse and plot data. Another important task is to query mlflow for your data and then perform analysis on it in your favorite toolchain like numpy and matplotlib.
We have a short tutorial that demonstrates the basics of logging, querying, and plotting using the MLFlow query api with UV reporting.
Note
This tutorial uses the matplotlib and numpy packages.
Similar to the above tutorial, this tutorial will create a local directory with your
MLFlow data under ./mlruns, and you can run a local mlflow server instance to view
your results in the same way.
This tutorial also demonstrates how to use mlflow’s query capabilities to search your run data and retrieve metric history data for analysis and plotting outside of the mlflow ui server. We also demonstrate how to use the mlflow api to store artifacts associated with runs.
In the tutorial.py code, in the _run_experiments method, you can
see that we perform several runs using different parameters. Here we configure
our MLFlow experiment name and our run name using the UV method uv.start_run:
def _run_experiments(experiment_name: str):
  for i, p in enumerate(PARAMETERS):
    with uv.start_run(
      experiment_name=experiment_name,
      run_name=f'run_{i}',
    ):
    uv.report_params(p)
    _compute(**p)
You may also specify the experiment name using the MLFLOW_EXPERIMENT_NAME
environment variable, and the run name using the MLFLOW_RUN_NAME environment
variable. For more information, please see the
MLFlow documentation
. Please note that the method arguments take precedence over the
environment variables, so you can always set them in your code and be sure that
these will be used.
After we have run our data generation code in the _run_experiments() call in
the main() routine, we query a subset of our runs by first creating an
MLFLow client
instance, then using that to call search_runs to find just
the runs we are interested in:
client = mlflow.tracking.MlflowClient()
experiment = client.get_experiment_by_name(experiment_name)

# get all of our runs where we set mean=0
mean_zero_runs = client.search_runs(
    experiment_ids=[experiment.experiment_id],
    filter_string='params.mean = "0"',
)
Here we pass an MLFlow query string, which has a SQL-like syntax. For more details on this query language, please see the MLFlow search syntax documentation.
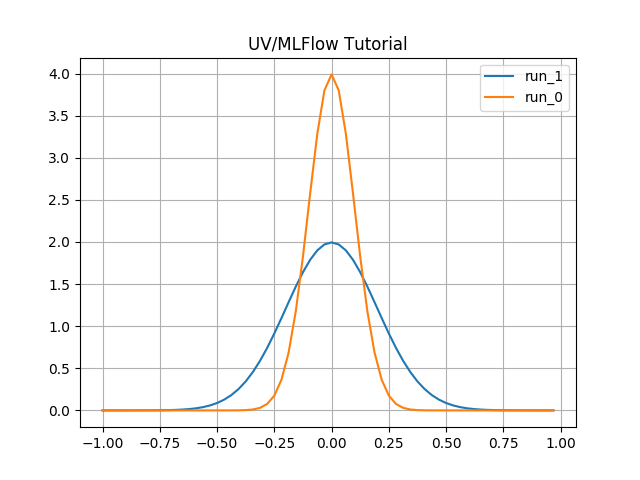
Once we have the runs that match our query, we retrieve our metric data and convert
it into numpy arrays for analysis and plotting, using the get_metric_history
MlflowClient method. As a simple example we then use matplotlib to plot this
simple data and output it to a .png file.